PlotDB Renderer API
Overview
Visworks including charts, visualizations or interactive contents on PlotDB are all designed to be executed independently. You can download their corresponding PlotDB.json and render it in any website with PlotDB API. PlotDB API also enpowers you to update their configuration, data, and even reuse them in multiple container simultaneously.
Additionally, visworks can be bundled into one single javascript library using Collection. to see how this works, go directly to the Viswork Library section for more information.
( In this document, we will both use the term viswork and chart, but they all refer to the same concept. )
License
Every viswork has its own license. Some are free of charge like MIT License, and some require subscription of PlotDB for commercial use (the PlotDB License), and some need you to purchase before using. Check each viswork for its license in settings -> library tab.
Sample Usage
In this section, we will step-by-step walk through the whole life cycle of a plotdb viswork.
Installation
Include plotdb.js and pdb.css in your website:
<link rel="stylesheet" type="text/css" href="plotdb.min.css"/>
<script type="text/javascript" src="plotdb.min.js"></script>
additionally, some charts depends on other external library like d3js, so we have to include them as well. To work with examples in this documentation, include following two JavaScript library:
<script src="//d3js.org/d3.v3.min.js"></script>
<script src="//plotdb.com/lib/plotd3/0.1.0/index.js"></script>
To find whih library to include for any chart, check settings -> library tab in each viswork.
Load Viswork
The most simple way to render a PlotDB chart is using visworks ID:
plotdb.load(2008, function(chart) {
  /* 'chart': your viswork object */
});
Here we use ID 2008 - which points to https://plotdb.com/chart/2008 - to get the source of corresponding viswork.
The returned object provides several useful methods for you to interact with it, for example, attach, which binds and renders your chart immediately into a container:
plotdb.load(2008, function(chart) {
  chart.attach("#my-container");
});
By default it renders with a sample data, like following:
Offline Rendering
Working with ID is convenient, yet it send an ajax request to PlotDB, so you need internet connect and your website will depend on PlotDB server for its content. To render a offline chart, download its PlotDB.json and use its URL to replace the viswork ID:
plotdb.load("url-to-plotdb.json", function(chart) {
  /* ... */
});
Customize Data
To render with customized data, use the data method:
plotdb.load("url-to-plotdb.json", function(chart) {
  chart.data(
    [                                  /* Our data */
      {name: "Pie",  value: 90},
      {name: "Bar",  value: 20},
      {name: "Line", value: 10}
    ],
    false,                             /* Render now or not */
    {                                  /* data -> viswork mapping */
      someDimension: ["name"],
      anotherDimension: ["value"]
    }
  );
  chart.attach("some-css-selector");   /* now attach and render */
});
chart.data takes three parameters:
- an array of object. in this case we have two objects with names "Pie" and "Bar" respectively.
- render immediately or not. set to false if it is called before attached.
- data to viswork binding. here we bind "name" to "color", and bind "value" to "length".
Every viswork has different data interface (the dimensions), so we have to check what kind of data they accept, and use the thrid parameter to bind our data with their dimensions.
For example, Pareto Chart (https://plotdb.com/chart/2008) has two dimensions amount and factor. which you can find in the data binding section under the chart. and this is our data:
[
    { name: "Pie",  value: 90 },
    { name: "Bar",  value: 20 },
    { name: "Line", value: 10 }
]
In this case we have 2 fields ( name andm value ) and 3 entries ( Pie, Bar and Line ), and we want to use name in factor dimension, and use value in amount dimension. All we have to do is create a mapping object:
{
    factor: ["name"],    /* map `name` to `factor` */
    amount: ["value"],   /* map `value` to `amount` */
}
and call chart.data with our data and this mapping object. Following is a workable example using data method:
plotdb.load(2008, function(chart) {
  chart.data(
    [
      { name: "Pie",  value: 90 },
      { name: "Bar",  value: 20 },
      { name: "Line", value: 90 },
    ],
    false,  /* be sure to set to true if chart.data is called after attached. */
    {
      factor: ["name"],
      amount: ["value"],
    }
  );
  chart.attach("#container2");
});
and the sample out will be like:
Configuration
Once we have our data in viswork, we may want to customize the style or settings in our viswork. To do so use the config method:
plotdb.load(2008, function(chart) {
  chart.data(...);
  chart.config({
    palette: { colors: [
      {hex: "#999"},
      {hex: "#ba8"},
      {hex: "#a8b"},
      {hex: "#8ab"}
    ]},
    fontSize: 14,
    yAxisDomainShow: false,
    ...
  });
  chart.attach("...");
});
Above example configure this viswork with a customized palette, font size and other configs, and will look likes:
similarly, author of viswork can design and name his/her config of viswork. These can be found in the code panel - look for config member of viswork - in the online editor (e.g., https://plotdb.com/chart/2008).
PlotDB also provides predefined configurations for creating viswork, to know more about configration, check the PlotDB Viswork Specification.
Resizing and re-rendering
PlotDB viswork will automatically render again if you resize the container. However, sometimes we want to render it manually, and this can be done by calling render method:
plotdb.load("url-to-plotdb.json", function(chart) {
  // ... config, data and attach ...
  chart.render();
});
you can even manually invoke the resize method to force it to recalculate its dimension:
plotdb.load("url-to-plotdb.json", function(chart) {
  // ... config, data and attach ...
  chart.resize();
  chart.render();
});
Additionally, if we want to update our data after rendering, we can set the doRender flag to true to tell PlotDB to render the new data immediately:
plotdb.load("url-to-plotdb.json", function(chart) {
  // ... config, data and attach ...
  chart.render();
  chart.data(
    newData,
    true,      // the `doRender` flag sets to `true`
    { ... }
  );
});
the following example update viswork with random data once every 4 seconds:
plotdb.load(2008, function(chart) {
  chart.attach("#container4");
  setInterval(function() {
    chart.data(
      [
        { name: "Pie", value: Math.random() },  // randomly generated value
        { name: "Line", value: Math.random() },
        { name: "Bar", value: Math.random() },
      ],
      true,
      { factor: ["name"], amount: ["value"]}
    );
  }, 2000);
});
which looks like:
Reusing Viswork
Every viswork object is dedicated to its container and can not be reusable in other container. However, you can make a copy of viswork object to reuse it by calling clone method:
plotdb.load("url-to-plotdb.json", function(chart) {
  var chart2 = chart.clone();
  chart.attach("#some-container");
  chart2.attach("#another-container");
});
Viswork Library
In most case, you may want to load viswork with JSONP style - to load all your visworks within a single <script> tag instead of through lots of ajax call. the Plotdb Collection mechanism can help you to bundle all visworks together, yet you can still do it yourself.
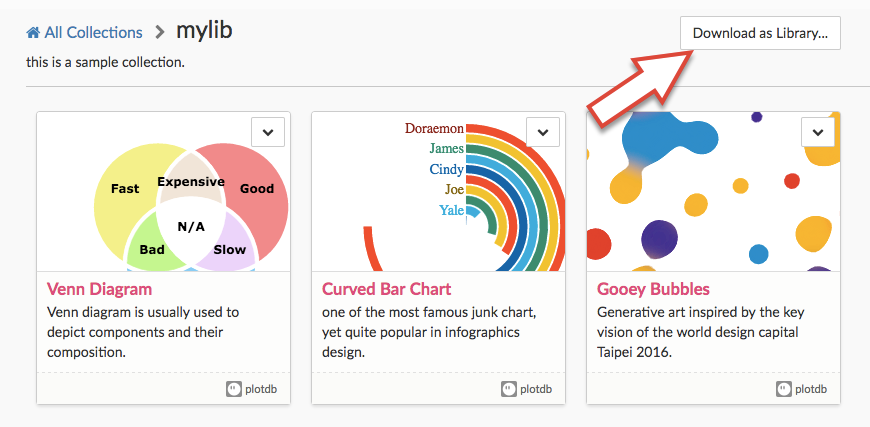
To quickly make a bundle of viswork:
- go to collection page through menu bar
- press '+create' to establish a new collection
- add some viswork into this collection
- press 'download as library' button on the right-top corner:
Manual Approach
To manually make a bundle of viswork, call plotdb.chart.add method with a name and the viswork JSON object:
plotdb.chart.add(
  "custom-viswork-name",    // unique name used to get this viswork
  { .... }                  // whole content of your PlotDB.json
);
multiple entries can be added at the same time, for example:
plotdb.chart.add("my-line-chart", { ... });
plotdb.chart.add("my-bar-chart", { ... });
plotdb.chart.add("my-pie-chart", { ... });
plotdb.chart.add("my-scatter-chart", { ... });
to get a viswork, call plotdb.chart.get method with the name of the viswork:
var chart = plotdb.chart.get("name-of-desired-viswork");the returned object is the same with the one returned by plotdb.load ajax call. Multiple calls to plotdb.chart.get will get multiple distinct viswork object, and can be used in different containers:
var chart1 = plotdb.chart.get("name-of-desired-viswork");
var chart2 = plotdb.chart.get("name-of-desired-viswork");
chart1.attach("#some-container");
chart2.attach("#another-container");
You can also retrieve all names by plotdb.chart.list. It will be useful when you are not sure what name to use to get those charts:
var list = plotdb.chart.list();Again, PlotDB Collection can help you bundle your own viswork library, so you dont have to bother downloading all visworks one by one and repack them manually when there are updates to one of them. Try create a collection and add your selected viswork into it.
Renderer API Reference
in both plotdb.chart.get and plotdb.load we get a viswork object, which provides following methods:
clone()
Make a copy of this chart. If you need multiple instance of this chart to render different data, you can use clone() to make multiple copies of the chart object, and render them to different containers respectively.
data(objArray, refresh, mapping)
Bind data with this chart. data() accepts an object array as the 1st parameter objArray, such as:
[{name: "Apple", price: 10}, {name: "Pen", price: 5}, ...]this parameter will be bound to the visual encodings of this chart by the schema we defined in the 3rd parameter mapping. mapping indicates which fields in the objArray should be mapped to which encoding, for example, following mapping maps field name to encoding color, and field price to encoding size:
{
  color: ["name"],
  size: ["price"]
}
Some chart accepts multiple fields in one encoding, such as line chart or stacked bar chat; specify multiple fields in corresponding array to bind multiple fields to a encoding, for example:
{
  name: ["name"],
  value: ["price-2016", "price-2015"]
}
After data binding we need to redraw the chart. You can invoke related functions by yourself or set the 2nd parameter refresh to true to let PlotDB to do it for you.
Every chart uses different visual encoding, check the dimension section in the code for the name of each encodings and the data type they expect. For example, following is a typical dimension section:
...
dimension: {
  value: { type: [plotdb.Number], multiple: true, require: true, desc: "y axis value" },
  order: { type: [plotdb.Order], require: false, desc: "x axis index" },
},
...
With above code we have 2 dimensions: value and order. value accepts multiple fields with number data type and is required, order accepts single field with ordinal data type, and is optional.
config(configObject, doRender, doRebind)
Update configurations of this chart. configObject is a Javascript object containing configurations to update; for example, to set font family of this chart:
chart.config(
  {
    fontFamily: "Tahoma"
  }
);
Configurations can be number, string of even object, depending on the design of this chart. Following example updates this chart with a new palette object and disable popup:
chart.config(
  {
    palette: {colors: [{hex: "#ff0000", "#00ff00"}],
    popupShow: false
  }
)
Every chart has different configurations, check the config section in the code for a list of the configuration available for your chart.
Update configuration itself will not trigger rendering. Be sure to invoke resize() and render() after updating configurations. If you change a configuration with rebindOnChange being true, you should also invoke parse() and bind() before calling resize():
chart.config({...});
chart.parse();
chart.bind();
chart.resize();
chart.render();
Yet, config() provides two additional parameters for doing this for you; if you set doRender to true, it will go through the rendering process; set doRebind to true will then force rebind even there is no configuration updated with rebindOnChange:
chart.config({...}, true);         /* will redraw. rebind according to the configs changed */
chart.config({...}, true, true);   /* will force rebind and redraw */
attach(htmlNode)
connect this chart with specific htmlNode. This will also render the chart into it. htmlNode should be a DOM element, so if you use jQuery to retrieve a node, pull its native DOM element out of the jQuery object at first:
chart.attach($("#some-node")[0]);PlotDB listens to window resize event to update chart, so if you adjust the dimension of the htmlNode programmatically, be sure to invoke resize() and render() to reflect the change to your chart.
init()
Initialize this chart. attach() will call init() so usually we dont have to call it manually.
parse()
Parse data before use in this chart. attach() will call parse() so usually we dont have to call it manually.
bind()
Bind data to DOM element. attach() will call bind() so usually we dont have to call it manually.
resize()
Update according to change in dimensions of container. PlotDB listens to window resize event and invoke resize() automatically, so if you manually change the dimension of container, you should also call resize() afterward.
render()
Render this chart. This should be called every time a chart needs update, for eaxmple, after resize() being called.
destroy()
Destroy this chart. This should be called when this chart is no longer needed, to finalize and clear any persistent resources it allocated.